
Around the grounds – December 2025
The state of play; what's happening in the markets. December 2025.
As always, there is plenty going on in the world, and plenty impacting the investment markets.
This is a general update in December 2025, plus our take on what we’re seeing, and how we have been responding.
We’re conscious that there has been a bit of noise about a potential AI bubble, so we’ll get stuck into that as well.
Executive Summary
1. Recent conditions
The last three years have been unusually strong across almost all asset classes, driven mostly by huge gains in US tech and AI-related companies. It’s been an exceptional run that’s unlikely to continue forever.
2. Is there an AI bubble?
A small group of giant tech companies now make up a very large share of global markets, and their valuations are very high compared with their earnings. This doesn’t guarantee a crash, but it does mean the market is more sensitive and future returns may be lower for affected asset classes.
3. What Keystone Wealth is doing
We have been steadily reducing exposure to the biggest US tech names and most expensive parts of the market. We’ve shifted more into areas with better value such as emerging markets, infrastructure, smaller companies, and private assets (where appropriate). We have kept cash sub-strategy accounts topped up (where applicable) to cover known withdrawals over the next two years.
A few great years
Following its launch in November 2022, when ChatGPT took a mere 5 days to reach its first 1 million users, (it took Facebook 10 months and Netflix 3.5 years), the world and investment markets seemingly believed that the world had changed forever.
After a strong couple of years for growth markets in 2023 and 2024, particularly international equities and specifically the US (driven by the explosion in AI related stocks), 2025 has kept on keeping on.
The following table shows returns by asset class by Calendar Year over the past three years.
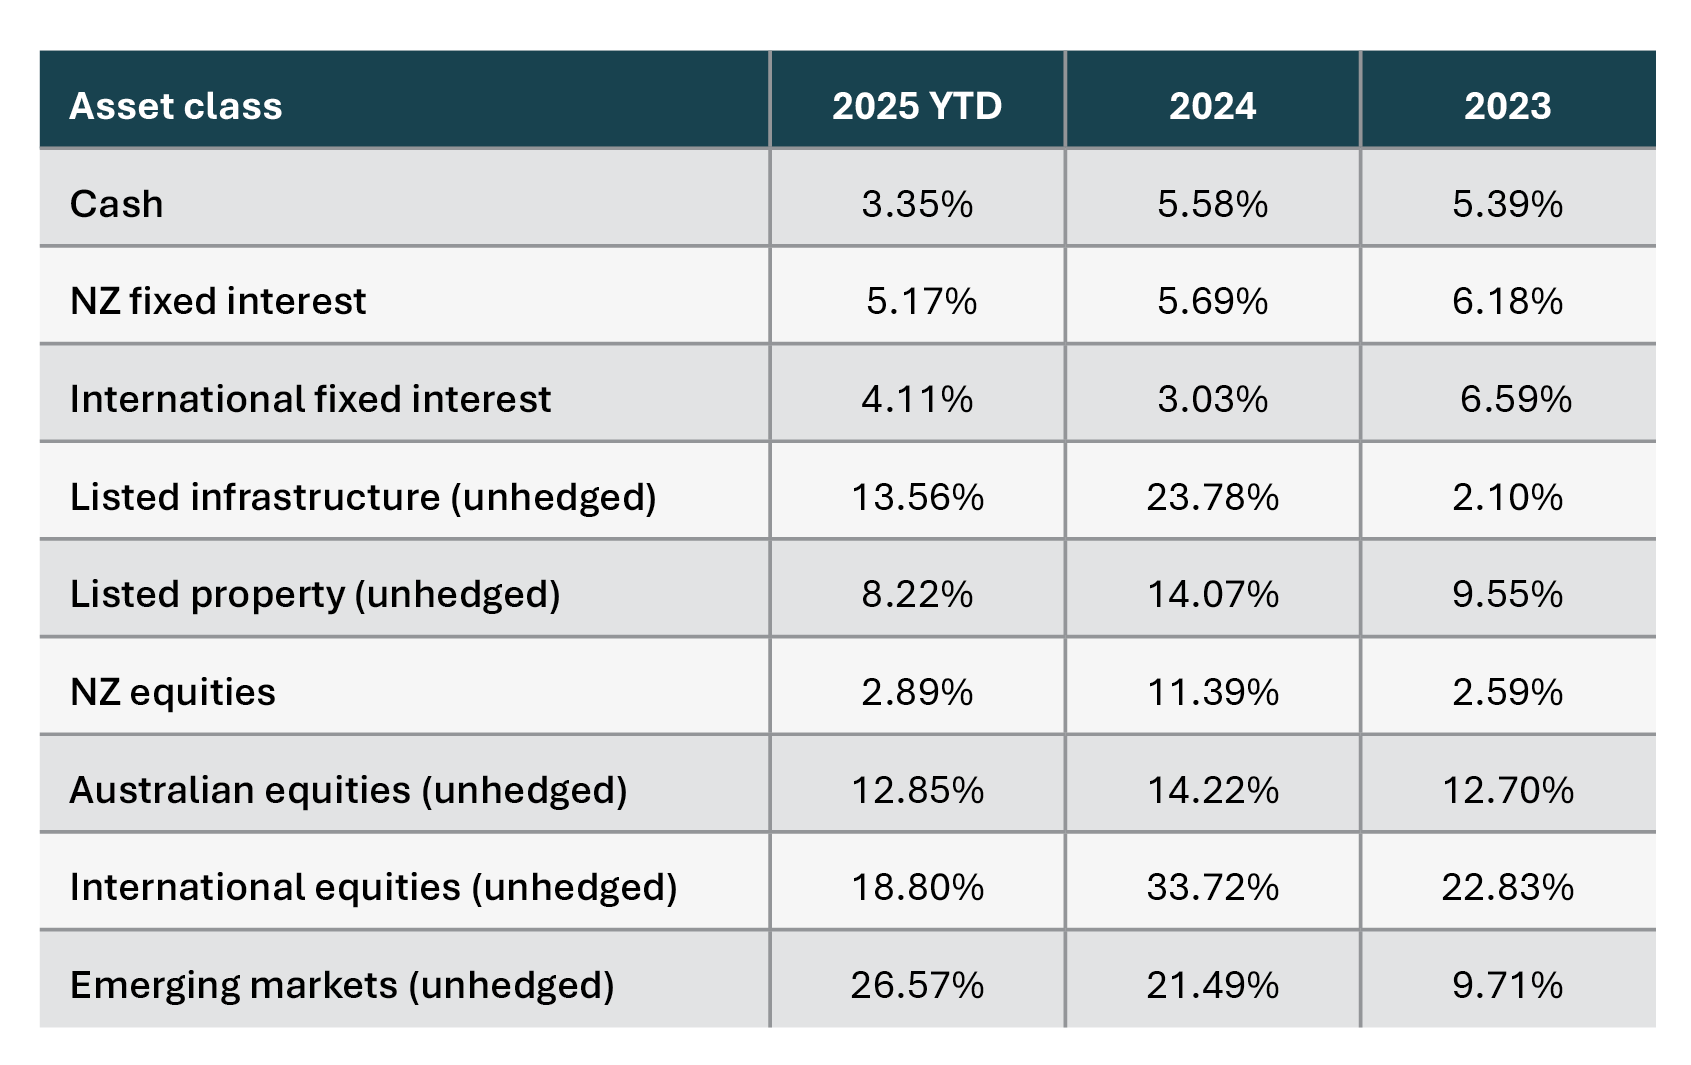
Source: Keystone Wealth & Morningstar Direct
All returns are in NZD and are unhedged (i.e. asset class and currency impacts are shown)
*30/11/2025
We have not included private assets or diversifying strategies because there is no meaningful index for these asset classes.
Growth assets have significantly outperformed for three years straight so it has been a great time to be invested, and even better for those that took on more investment risk (isn’t hindsight a wonderful thing!).
It is highly unusual to see all asset classes with positive annual returns for three years running. So unusual in fact, that it hasn’t happened at all in the last decade (despite a very strong decade for markets). The closest it came was in 2016 and 2017 with back-to-back positive returns across all asset classes (and that was a one-off for the decade).
Is AI a bubble?
Is the Market about to crash?
The last three years has been fuelled by AI, growth, and ever-increasing valuations, which has led to severe concentration in some parts of the market. Let’s walk through some of the data.
How did we get here
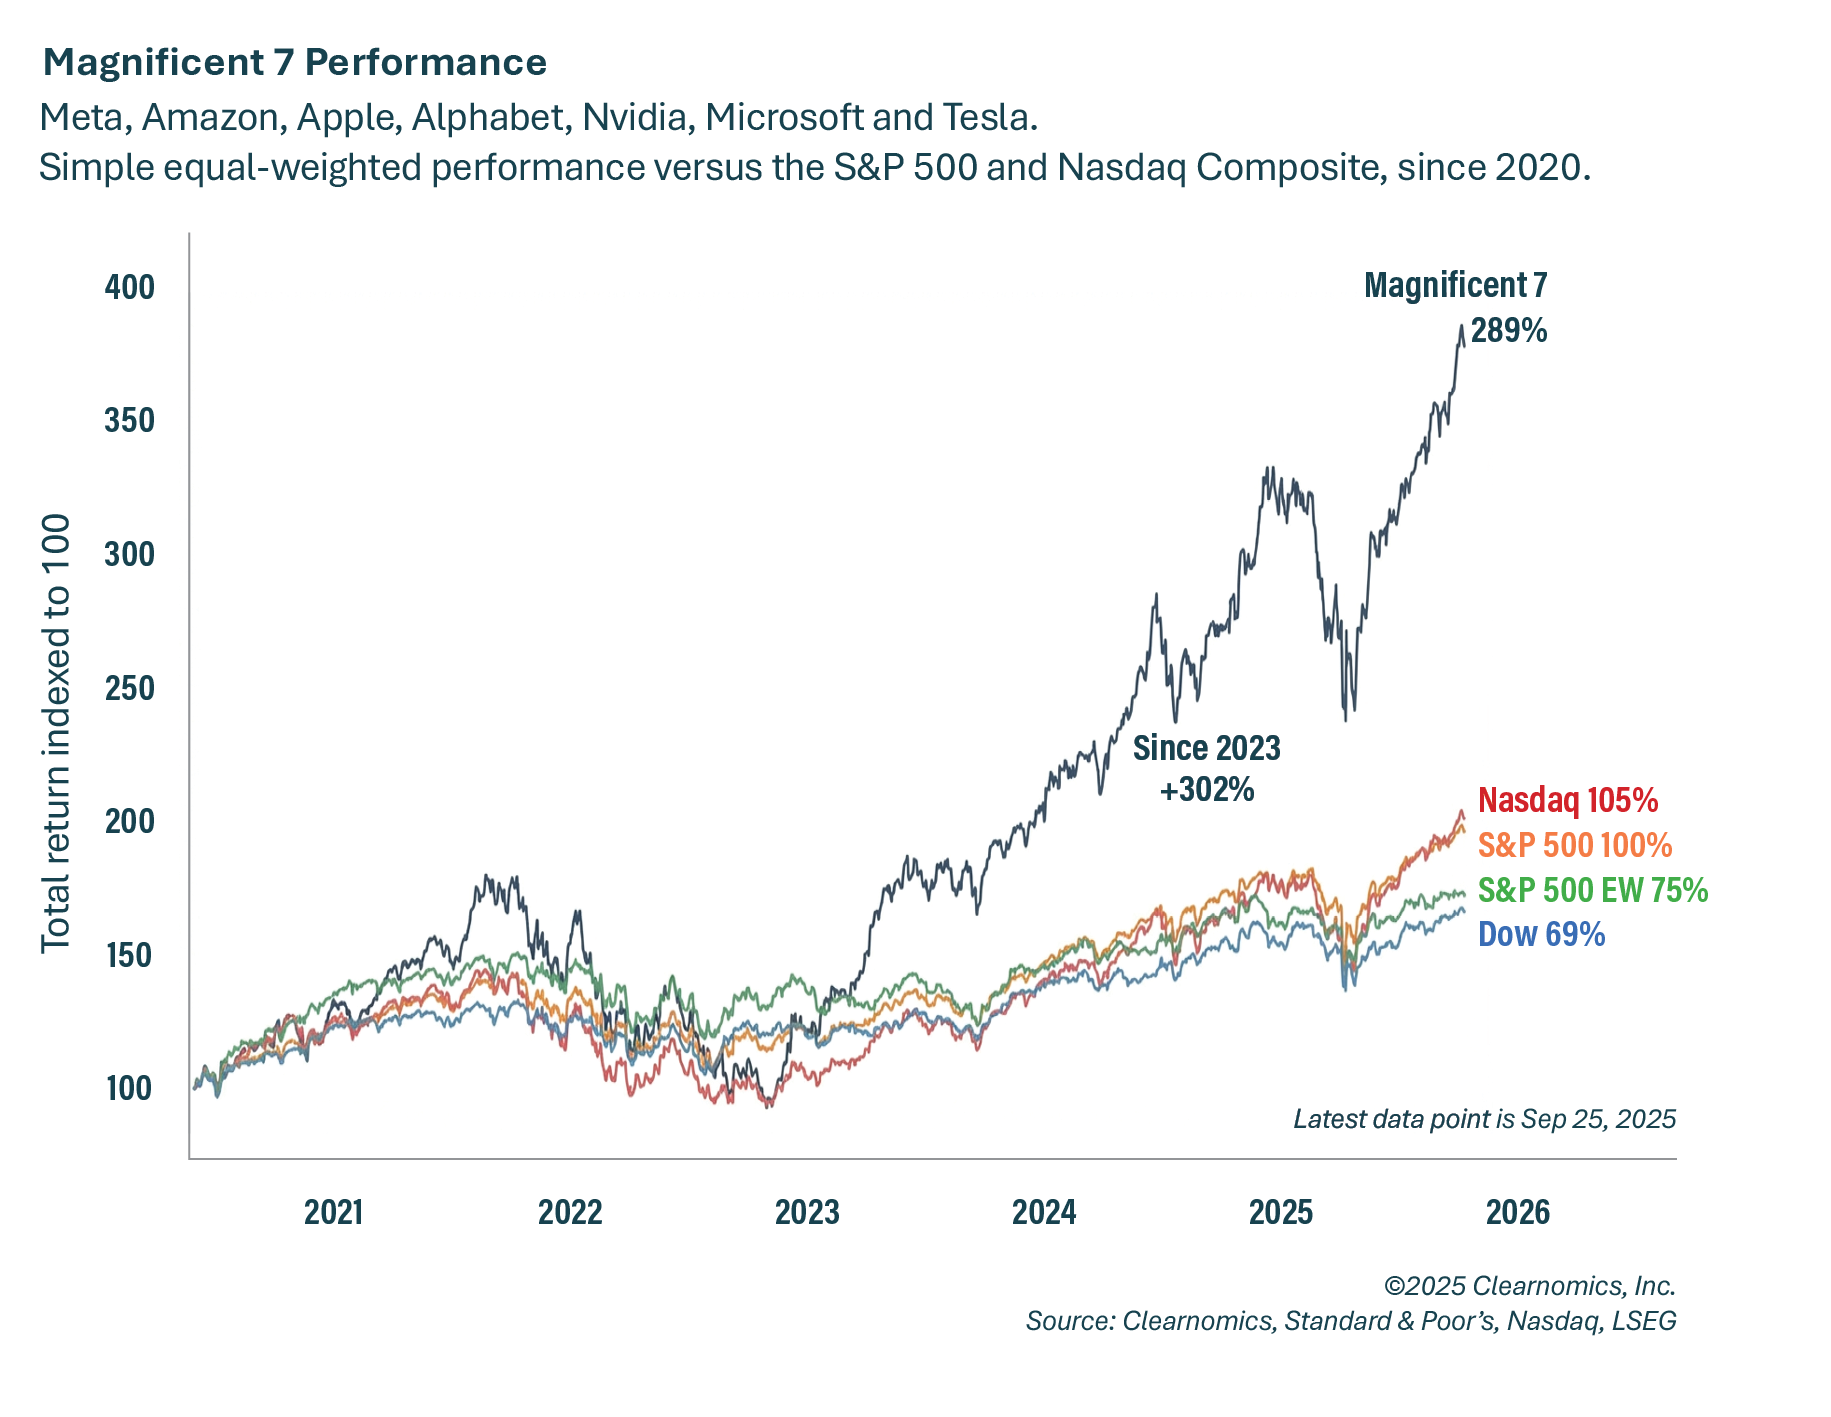
Performance over the last few years has been concentrated and dominated by AI thematic plays. According to some analysis conducted by JPMorgan, AI related stocks have accounted for 75% of the returns in the S&P500 across the almost three-year period since ChatGPT was launched. The Magnificent 7 have had much to do with this…
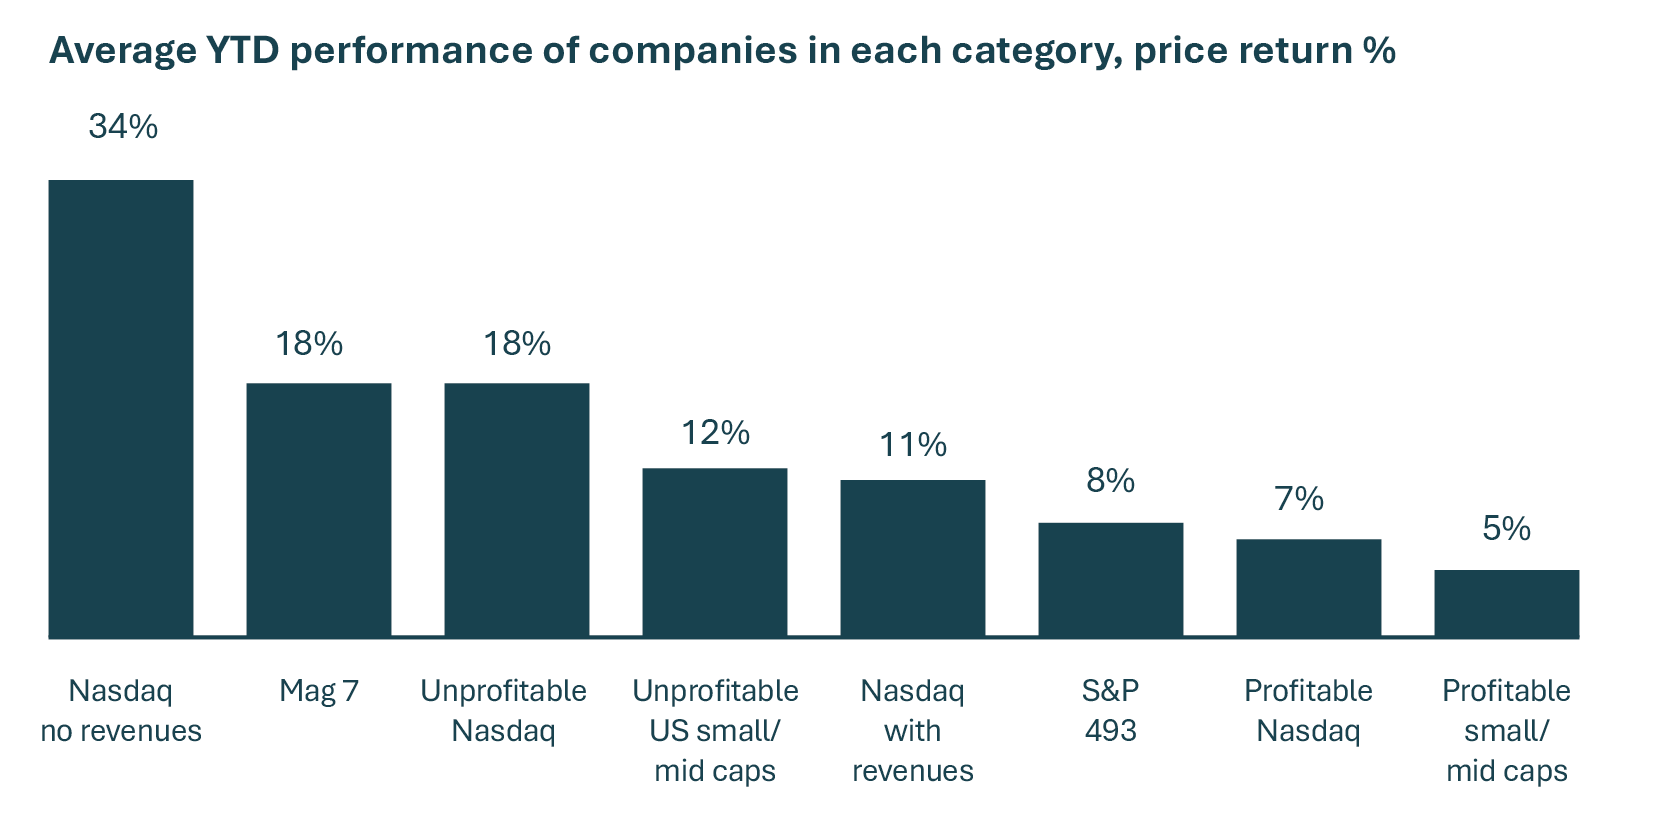
In 2025 AI thematics seem to have mattered more than profits
This chart from Schroders shows the breakdown of returns YTD (to September) in the US market. It turns out that the perfect business plan for 2025 was to not be profitable and it would seem, even better if you didn’t bring in any revenue!
But is the market starting to wonder about the hype
This chart from Gartner (produced back in 2018) is a useful visual of the typical adoption of a new technology.
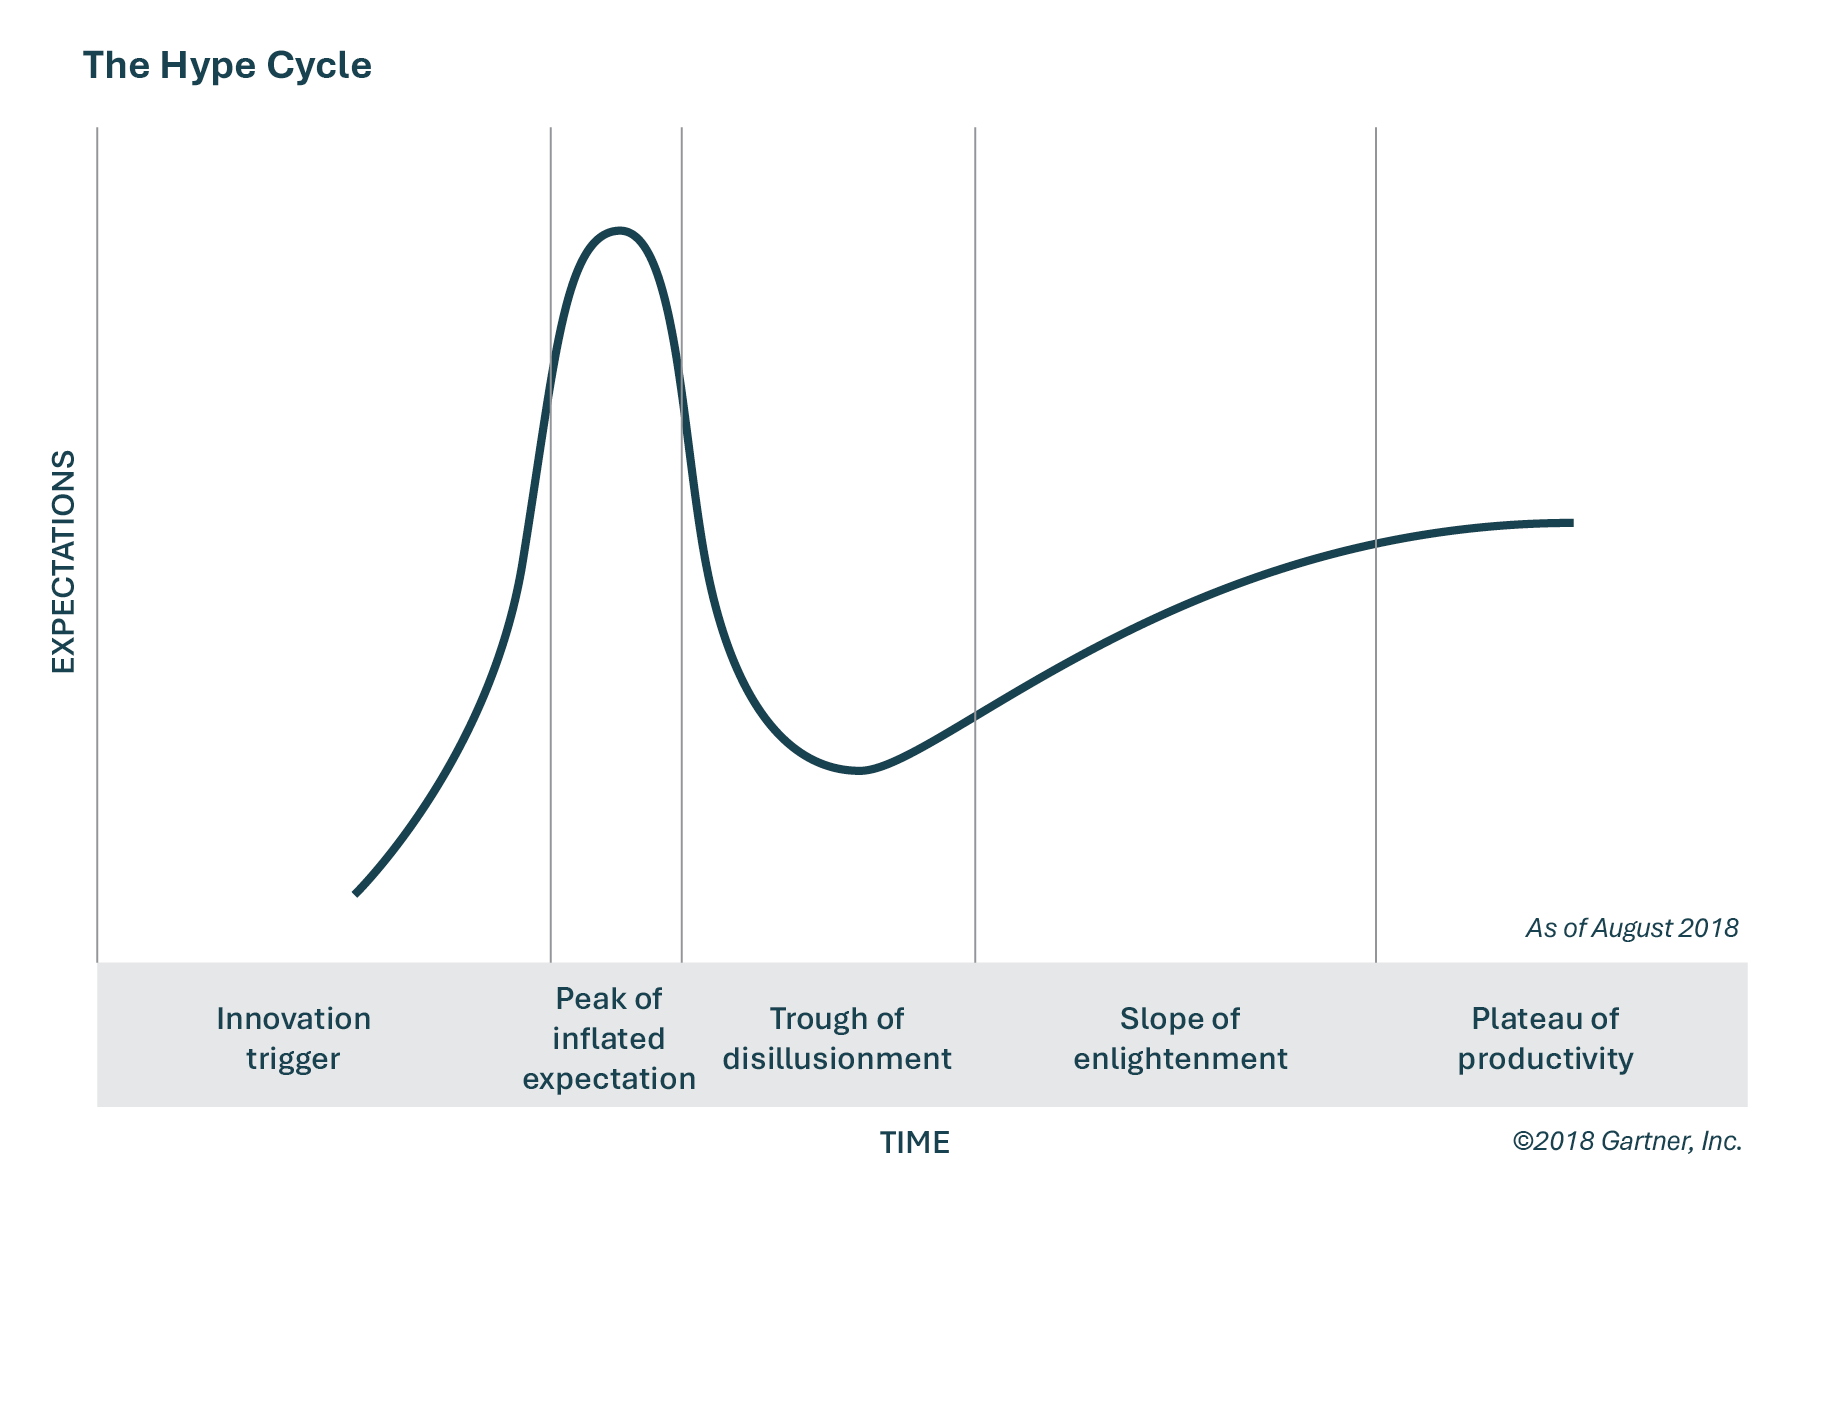
This makes sense if you think back to when the internet began and email arrived.
It took (quite) a few years before email and the internet actually delivered on the expectations.
Where we are now?
The other side of strong outperformance is increasing market concentration, particularly when this outperformance is from the biggest stocks which also hold the biggest weights in indices and portfolios.
Let’s take a look at some of the data:
The S&P 500 – essentially the largest 500 stocks in the US – comprises approximately 70% of the total world equity index currently.
The top 10 stocks in the S&P500 (including the Magnificent 7), comprise more than 40% of the index. Yes, 2% of the companies in the S&P 500 are responsible for 40% of the “market value”. By comparison, this was less than 20% coming out of the GFC and didn’t pass 30% at the height of the dot-com bubble.
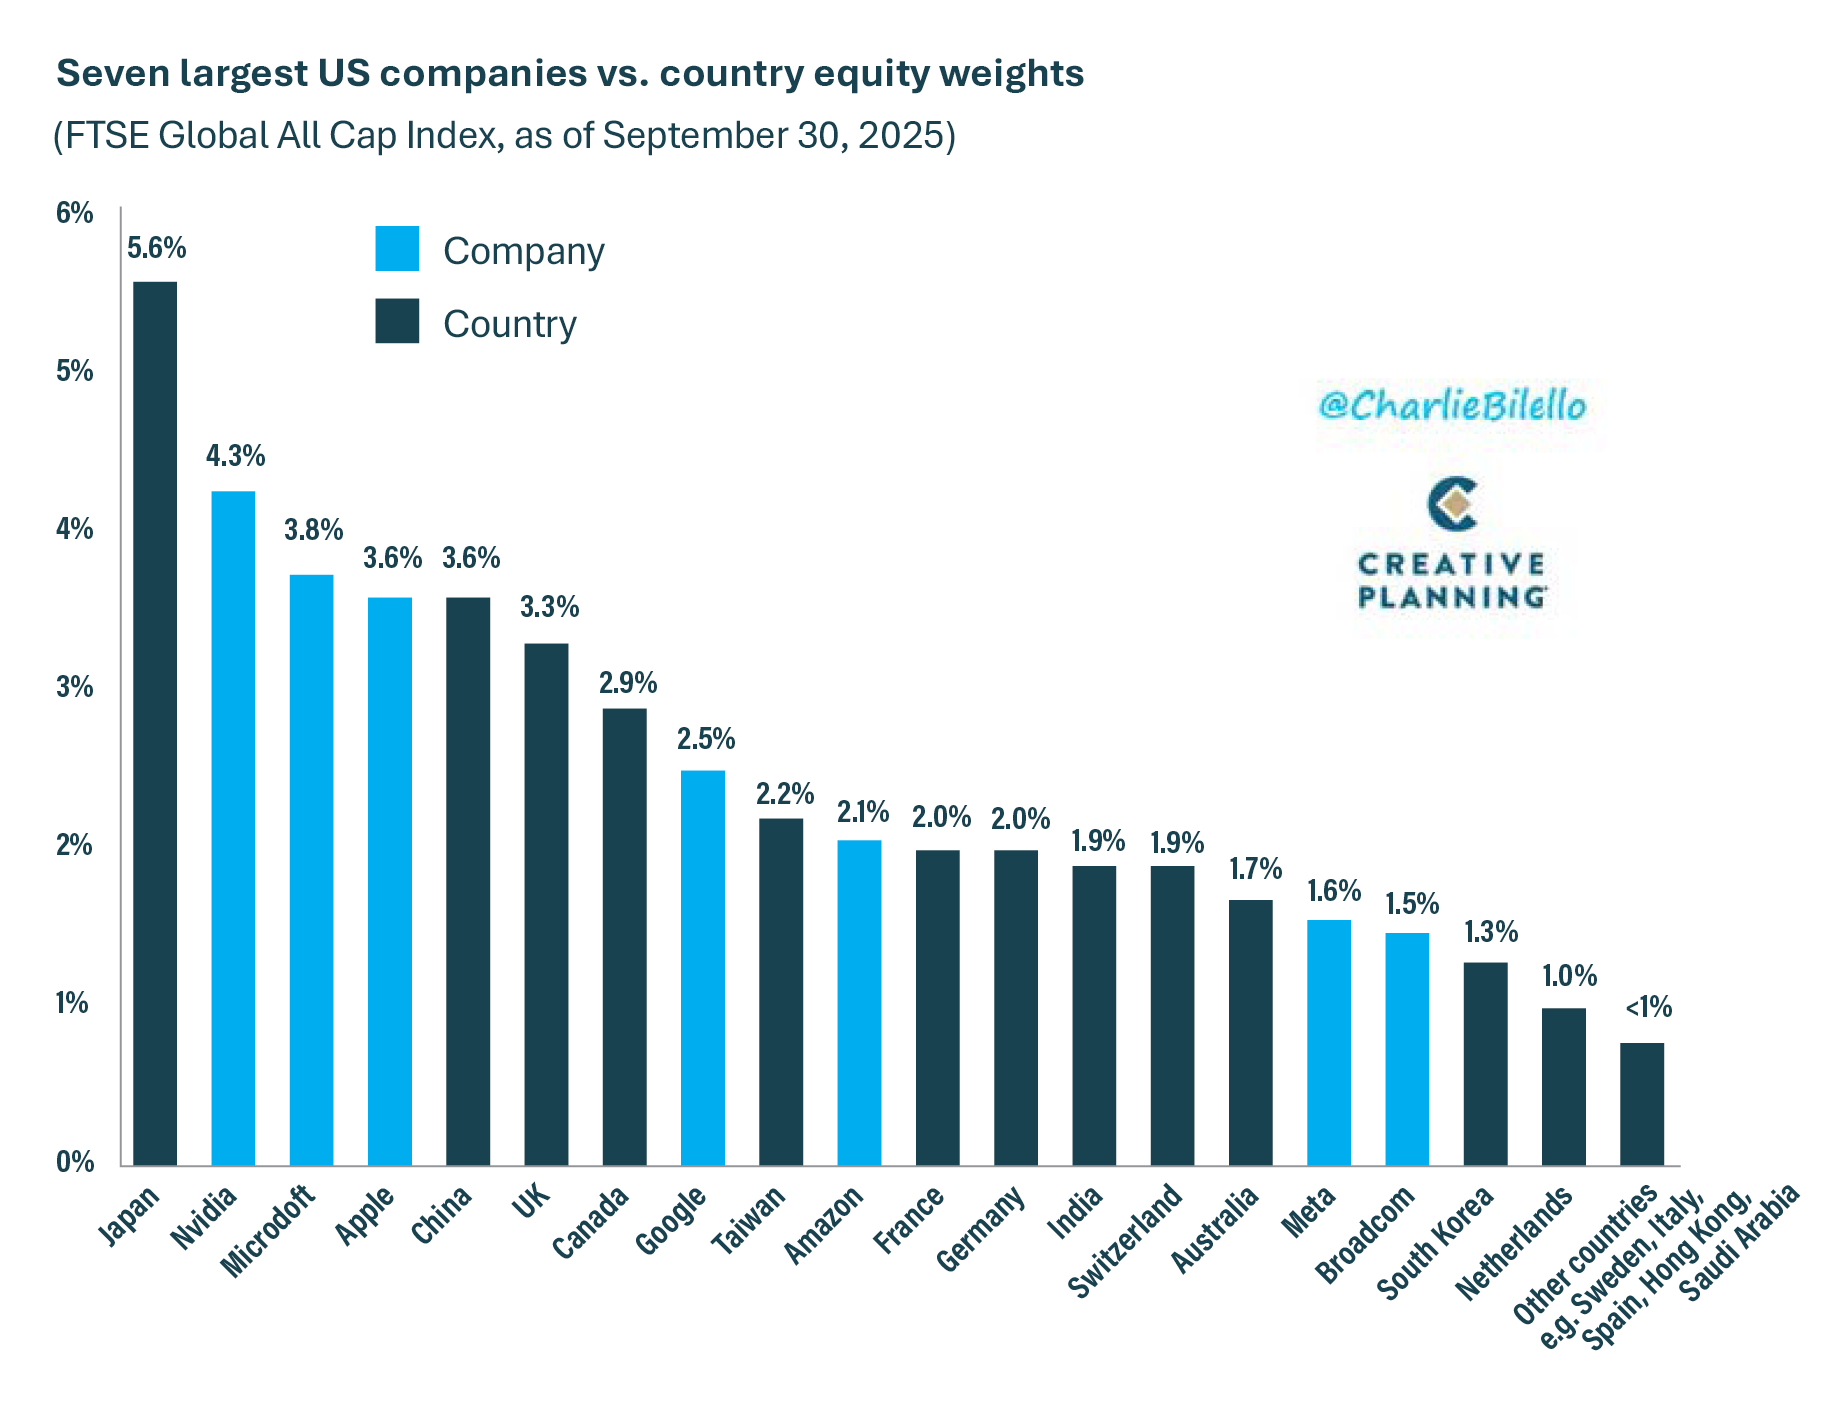
And for the global index, other than the US, only Japan can currently say that it has a larger weighting than Nvidia, Microsoft and Apple. The index weights of the 7 largest US stocks are comparable to other entire countries!
What about valuations
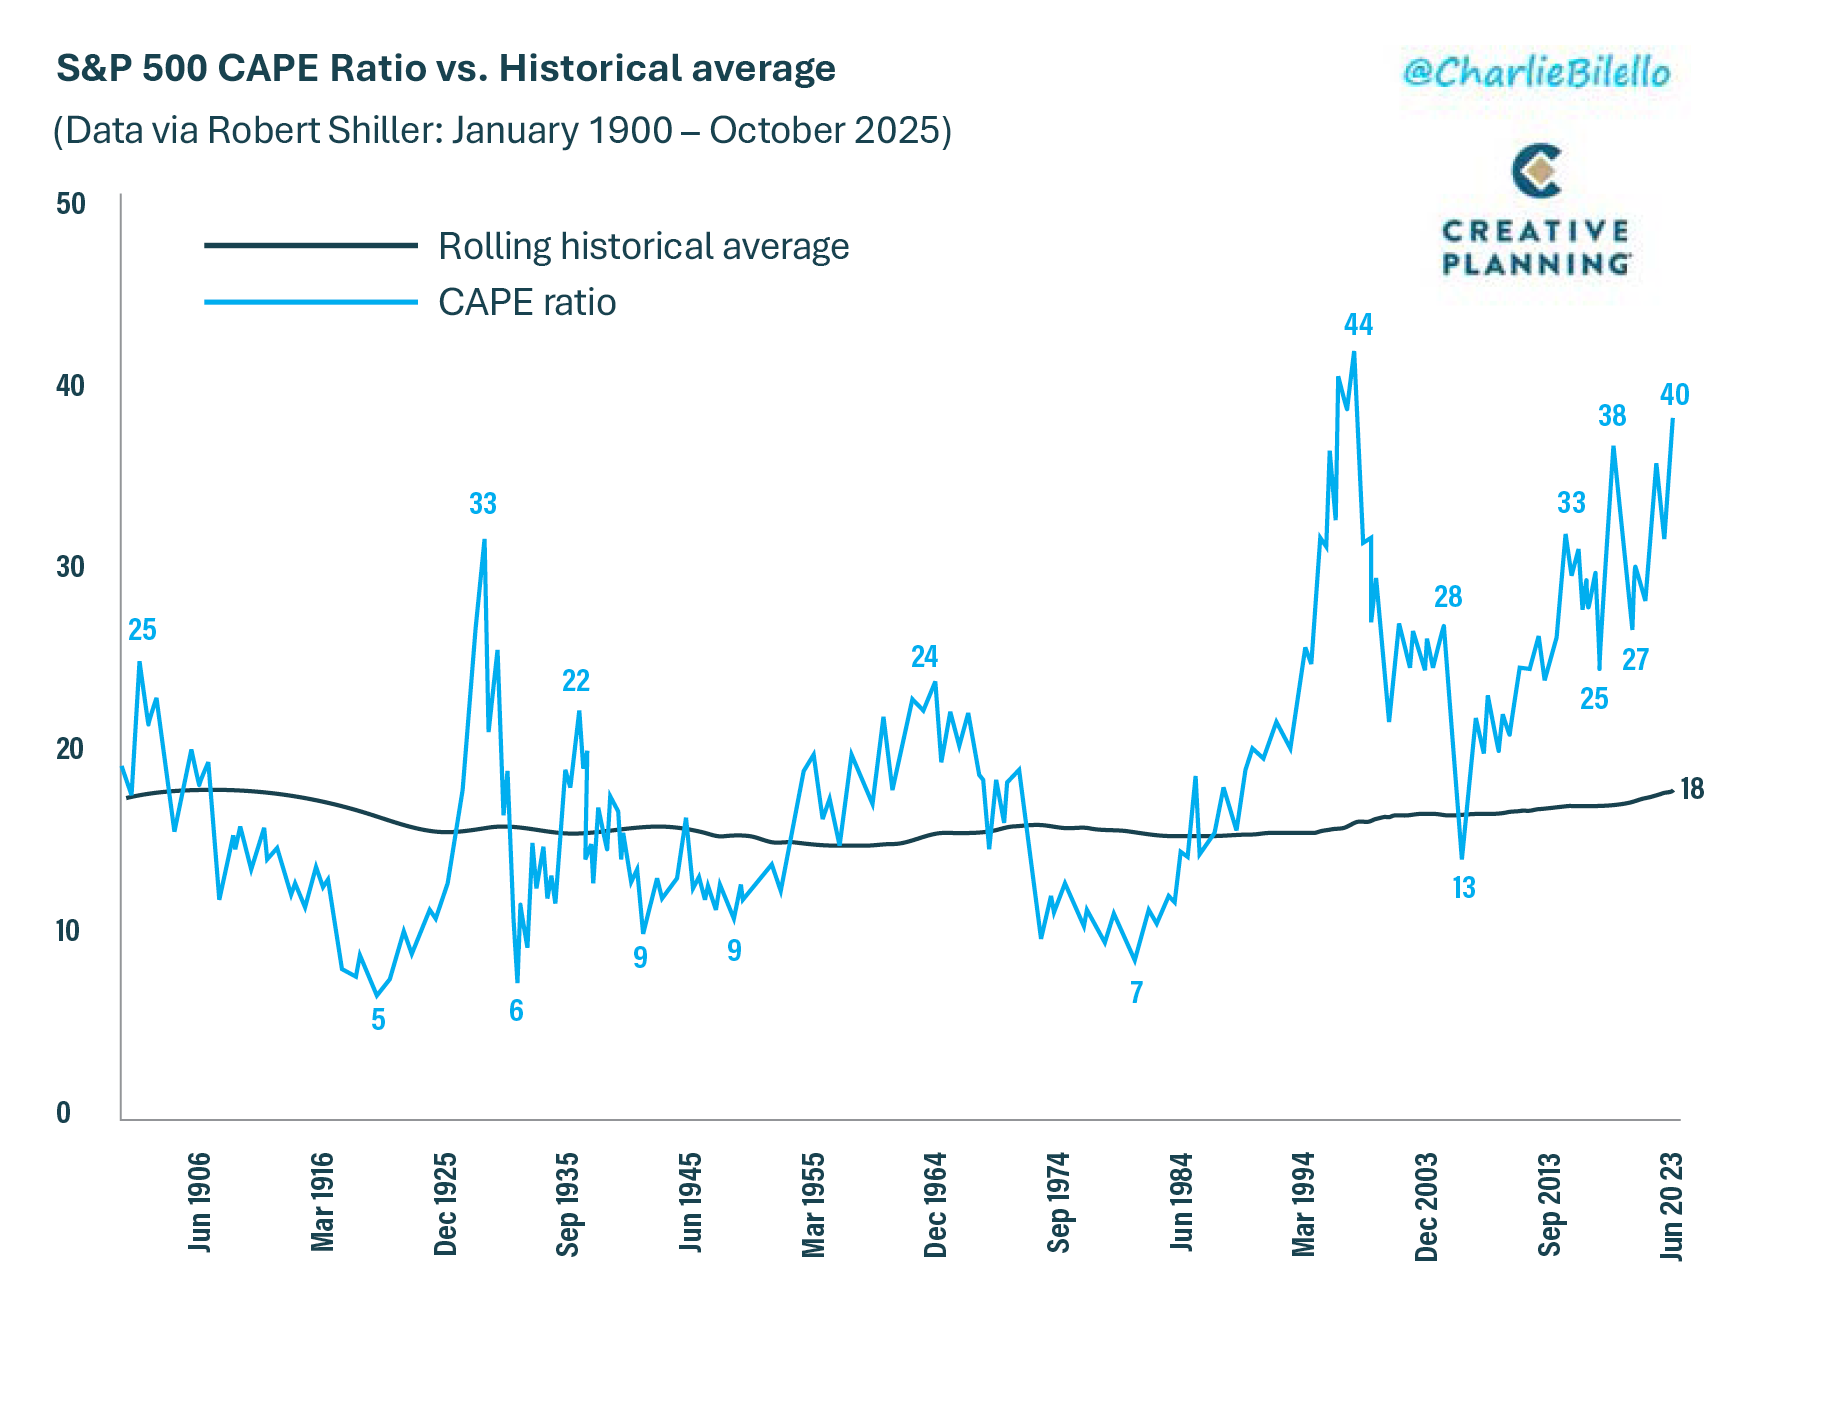
A quick look at the CAPE (Cyclically Adjusted Price to Earnings) ratio (we can provide more info for those who are interested) for the S&P500 shows we have only ever been higher than this during the dot-com bubble. It was a difficult decade that followed for the index.
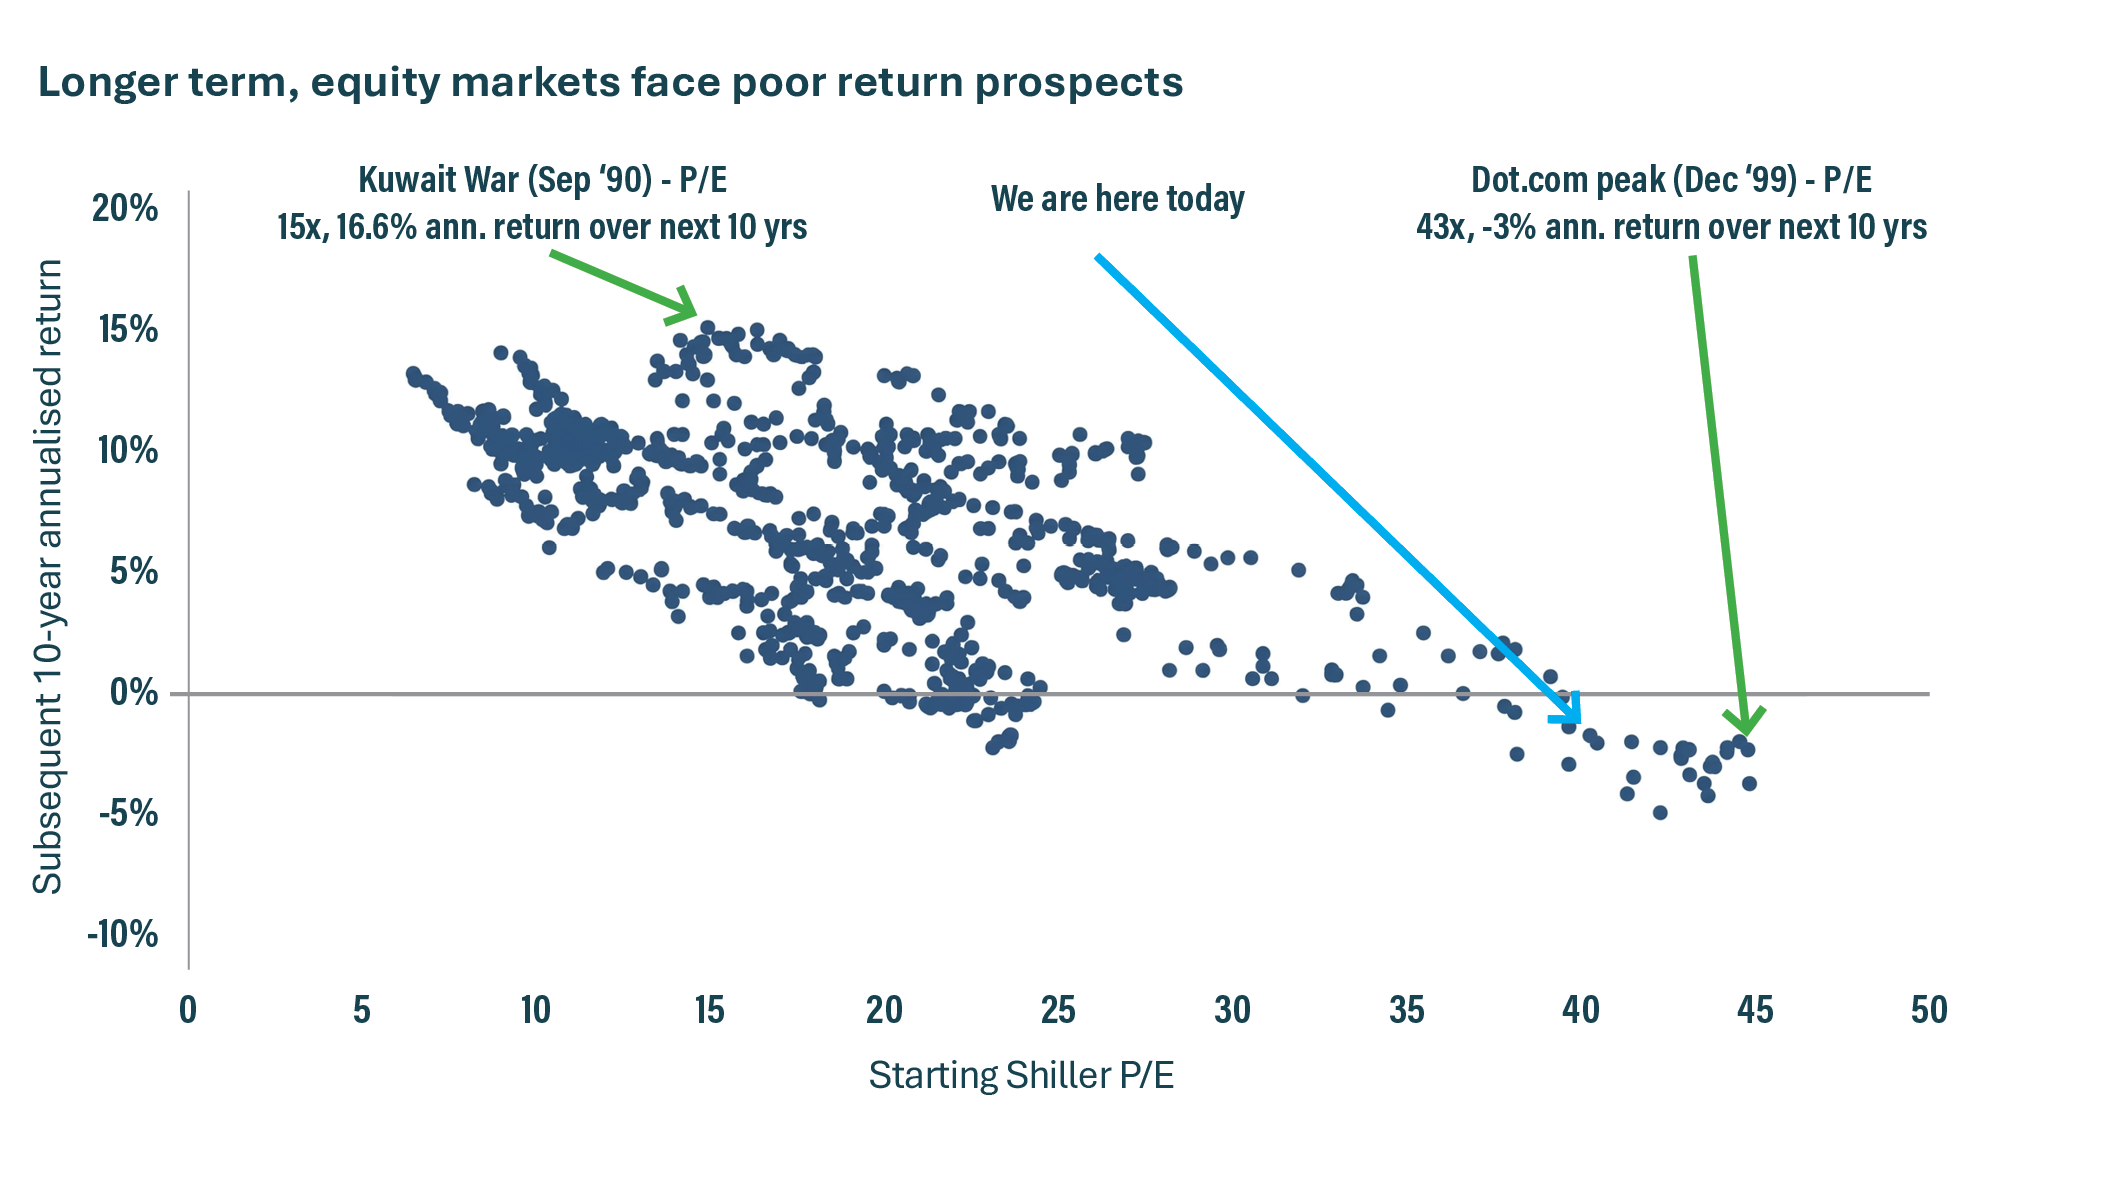
Typically, the higher the CAPE, the lower the long-term expected returns, as you can see from the following graph from Talaria, relating to the S&P500.
Some things to keep in mind
Most of the data and charts we have touched on so far are US related and more specifically are related to one segment of the market (i.e. the S&P500). Although as mentioned, these stocks do comprise a large part of the broader international indices.
It’s not all bad – there are still plenty of areas where you can still pay a “fair” price and where potential expected returns still look decent. This applies within international equities, as well as across other asset classes.
While valuations are important for long-term investors, they do not predict short-term market movements. History shows that expensive markets can perform well for extended periods if the economy remains healthy. However, valuations can help to determine an appropriate asset allocation mix, which can be adjusted as the market cycle evolves.
The current environment features several factors that have pushed valuations higher and could keep them there for a while, including at a market level: corporate earnings continuing to grow at healthy double-digit rates, profit margins are remaining strong, and balance sheets are healthy. Plus, the Fed's rate cuts provide a favourable backdrop.
While valuations are high for the broad global index (and the US especially), they are not particularly high across all parts of the market. While investors may be paying a premium for future growth expectations in certain sectors – particularly for technology companies – other sectors, styles, and sizes have favourable valuations and healthy earnings growth expectations.
What if this AI expansion unwinds?
While every time is different, including today, let’s look at last time the S&P500 was valued this highly (as determined by the CAPE) and had elevated concentration (though not to the extent we see today). Following the dot-com crash, investors in the S&P500 would have gone on to suffer negative returns over the next decade, however there were still decent long-term returns to be had across several other asset classes.
The key to managing any extremes in sectors of the market is diversification, as can be seen by the following chart from Ritholtz Wealth Management.
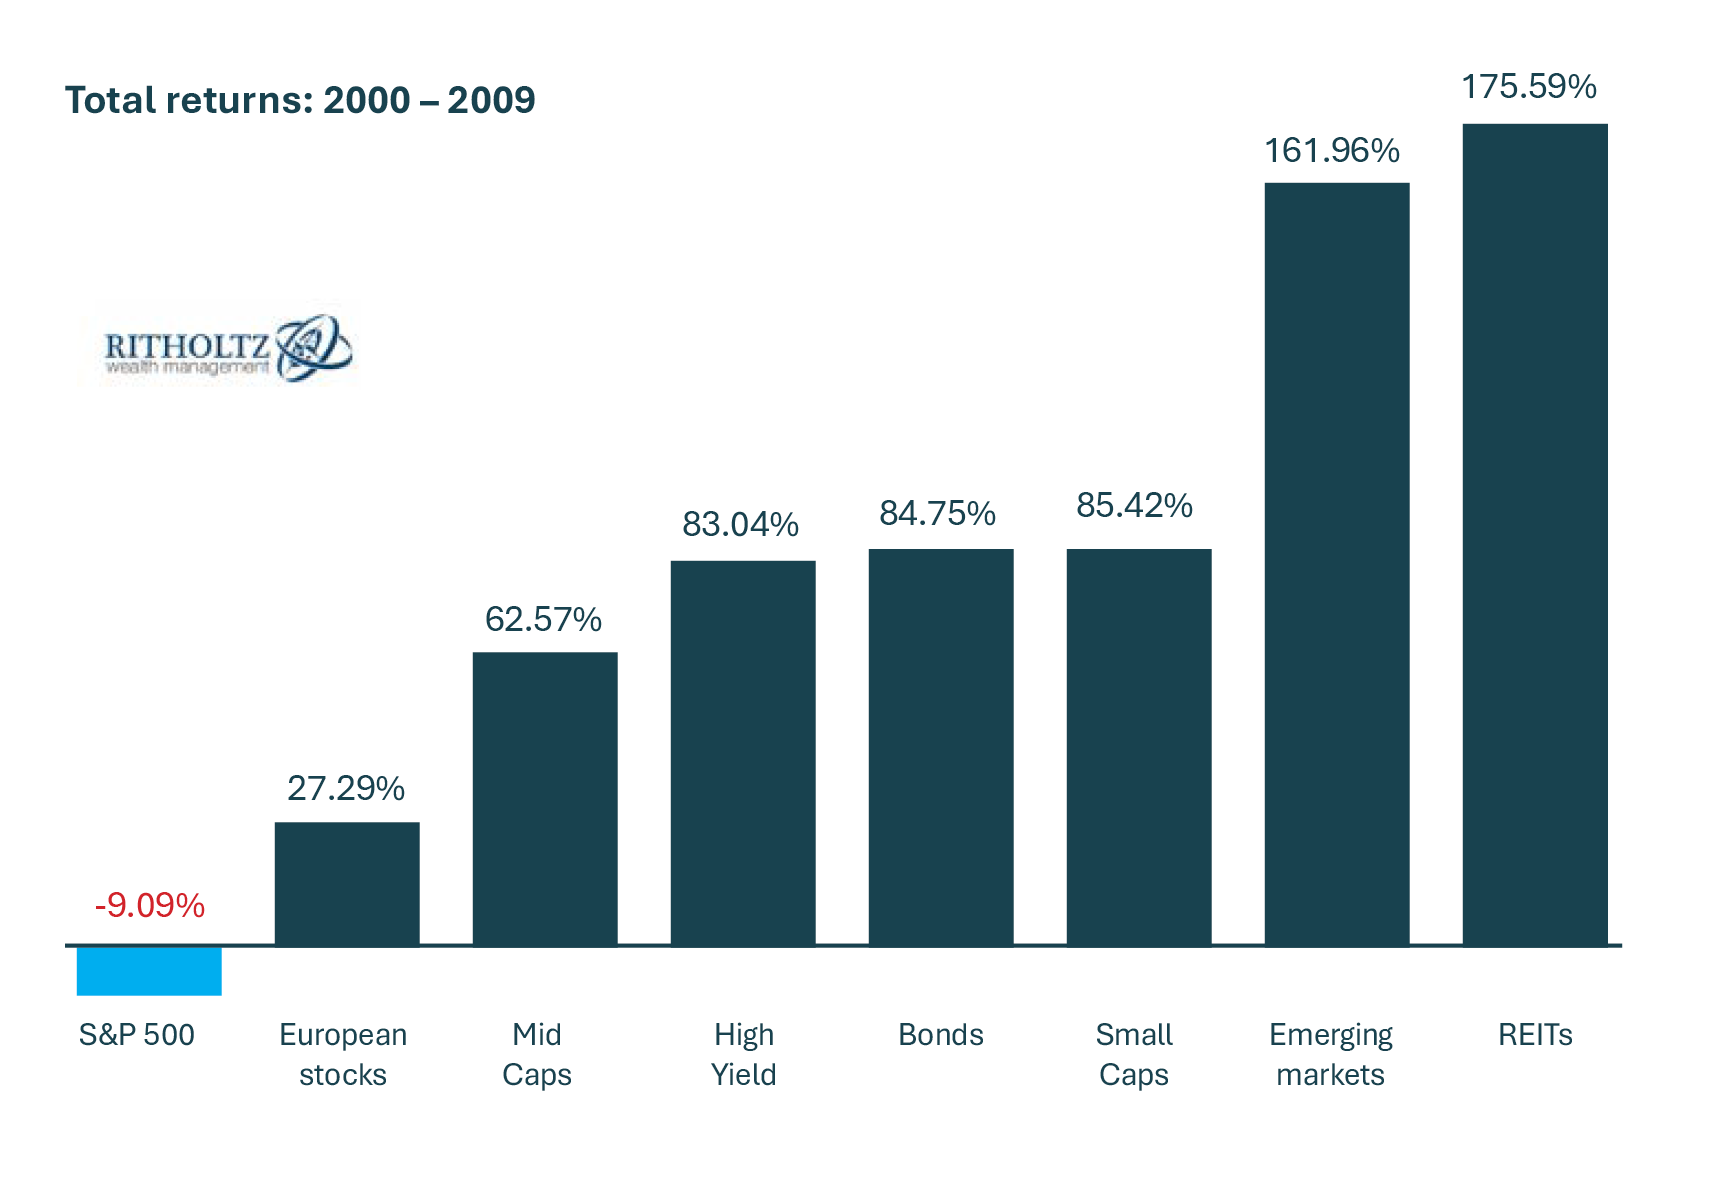
As a long-term investor, the best approach to managing risk and the uncertainty that comes your way in any given period is to diversify and always have a portfolio that aligns with your long-term risk profile.
If you invest for long enough, it is inevitable that you will experience some tough market environments along the way. However, trying to outright time these periods is a dangerous game and one that not even the smartest minds have had much success with getting right consistently.
So what are we doing about all this (if anything)?
As per our investment philosophy, we continue to diversify across a broad range of asset classes to reduce the range of outcomes in any given year.
With continually rising valuations and the increasing concentration in passive market indices and products, we have been reducing risk accordingly (selling into strength).
Changes we have been making to portfolios, managers, and funds over the last year have resulted in:
Reducing exposure to the Magnificent 7 (and Mega Cap and Large Cap stocks more generally).
Reducing exposure to the US.
Reducing exposure to the Growth equities style.
Maintaining an overweight exposure to Emerging Markets.
Maintaining an overweight exposure to Infrastructure.
Increasing exposure to Small and Mid (SMiD) Cap stocks.
Increasing exposure to the Value equities style.
Increasing exposure to Private Assets (where applicable).
How does this help?
To give this tangible context; earlier this year the markets dropped from the peak on 18/02/2025 to the trough on 08/04/25. The following was the portfolio experience of our Balanced Growth portfolio compared with the market:
Global Equities: -19.89%
The 28 balanced funds in the Morningstar balanced peer universe median: -7.17%
Keystone Wealth Balanced Growth portfolio: -4.37%
We are strong proponents of protecting the downside.
Topping up your Cash sub-strategy
To provide some protection against volatility, we operate a Cash Sub-Strategy alongside your Core Sub-Strategy.
If you are a regular withdrawer or have notified us of a specific withdrawal requirement, we utilise the Cash Sub-Strategy to protect against near-term downside volatility.
At any given time, we may hold up to two year’s known cash requirements in this sub-strategy to minimise the impacts of market volatility on your regular or one-off withdrawal(s).
We have been keeping this allocation topped up by profit taking from your Core Sub-Strategy, to protect against a potential market correction.
Other updates
You may have noticed that our email communications have changed. We’re still working through a few teething issues as we embed the new system, but as we continue to leverage the full functionality, we hope to bring you easier to read content that enables you to drill down on what is important or of interest to you, and to read the executive summary for the rest.
We also have a whole new range of Investment Insights ready for you for next year. As always, feedback and requests are most welcome.
As always, if you have any questions or would like to discuss your circumstances, please let us know.